https://electroverse.net/north-america-snow-off-the-charts-as-earth-sinks-below-1979-2000-avg/

Thousands of low temperature records have fallen across North America during these past few days alone, with record snowfall accompanying the cold, driving the continent’s snow cover extent to near-unprecedented levels. On top of that, the global average temperature (if you believe such a thing can be measured) has now dipped below the 1979-2000 average.
NORTH AMERICA SNOW COVER EXTENT ALMOST OFF THE CHARTS
According to data from Environment and Climate Change Canada, snow cover extent in North America is threatening to bust the Y axis (as of Feb. 16–the latest observation point):

The continents snow cover is now comfortably above the 1998-2011 average, and rising rapidly.
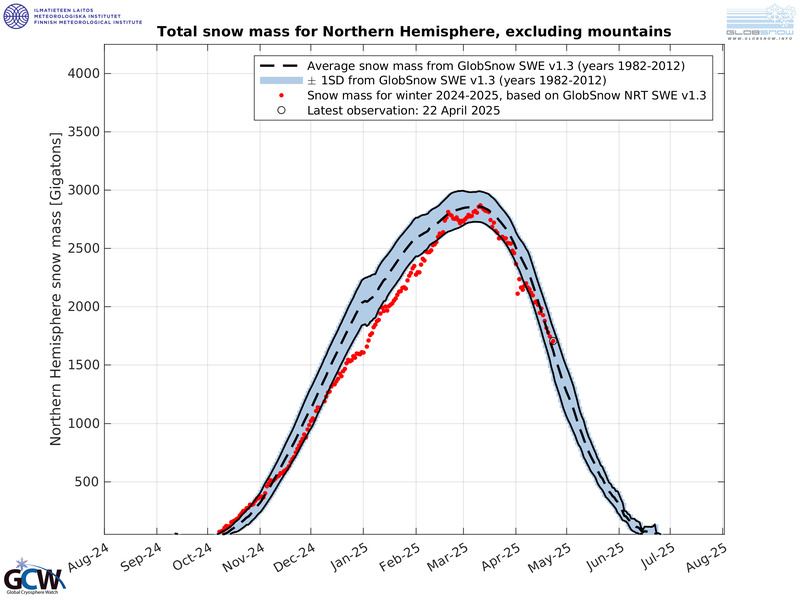
Furthermore, this picture of impressive pow-pow isn’t just confined to North America: total snow mass for the Northern Hemisphere is also riding above the average (1982-2012), by some 600 Gigatons no less:
Through December, 2020 and January, 2021 the UAH Satellite-Based Temperature of the Global Lower Atmosphere revealed that Earth cooled dramatically — and looking ahead, the dataset is expected to show a dip below baseline for the month of February (released early March).
An organization that keeps track of Earth’s daily temperature is the Climate Change Change Institute at the University of Maine. According to them –who depict output from the operational NOAA Global Forecast System (GFS) model– today (Feb. 17) our planet is running 0.1C BELOW the 1979-2000 average (prevented from falling lower by a slightly warming Arctic–a phenomenon expected during times of low solar activity: click here for more on that).

The Climate Change Institute at the University of Maine explains their data:
“2m Temperature Anomaly refers to the departure of the current day’s forecasted temperature from a long-term mean for the same day of the year. The anomalies here are based on a 1979-2000 reference climatology derived from the NCEP Climate Forecast System Reanalysis (CFSR). This 22-year baseline is used instead of the more common 1981-2010 climate normal because 1979-2000 represents conditions prior to rapid Arctic warming and sea-ice loss”–in other words, falling below this period of climatological reference is an even more impressive feat, and it comfortably puts to bed any lingering fears of “global warming”.
However, that AGW ruse will, of course, continue.
We will continue to be told snow is becoming a thing of the past.
We will continue to be scared into believing vast regions of the planet are being baked out of existence due to rising global temperatures, and that bouts of extreme cold are becoming less and less prevalent and pronounced.
And as a result of these barefaced lies will continue to commit energy suicide, replacing dependable fossil fuels with wholly-unreliable renewables — a sacrifice that will render ourselves useless against the ever-worsening winters of the Grand Solar Minimum:

Recommend this post and follow The Life of Earth
https://disqus.com/home/forum/lifeofearth/
No comments:
Post a Comment
Stick to the subject, NO religion, or Party politics